About
Fourth-year Mathematics & Statistics student at McMaster University with a focus on data analytics and data science. Currently interning as an Analytics Intern at Tolmar Inc., a pharmaceutical company, where I apply analytical skills in a real-world industry setting. I enjoy turning raw data into clear, actionable insights through Python, SQL, and Power BI.
Work Experience
Volunteer Experience

Skills
Check out my latest work
I've worked on a variety of projects. Here are a few of my favourites.
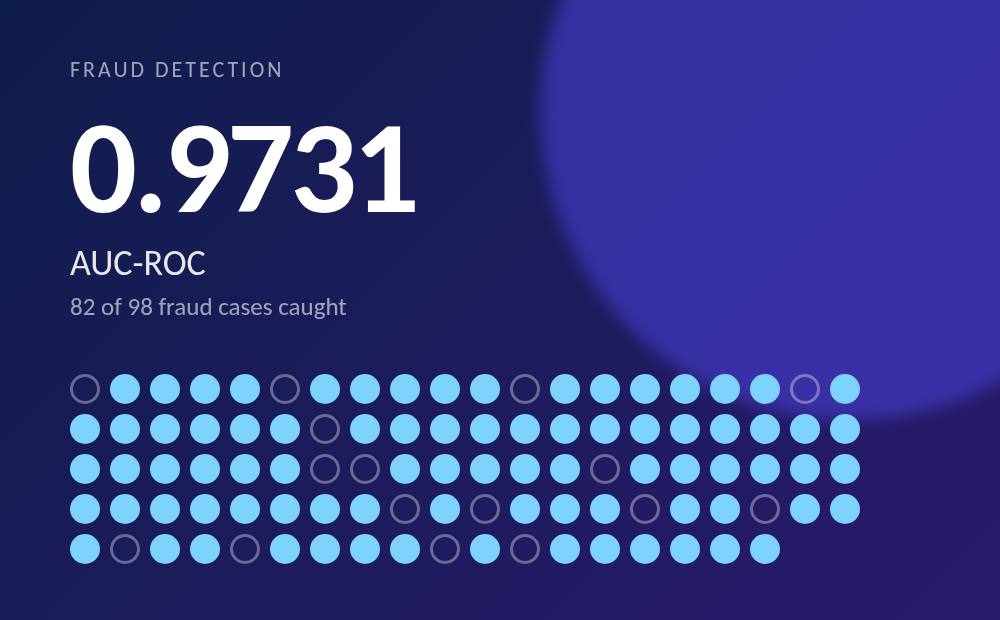
Built a Random Forest classifier to detect fraudulent transactions across 284,807 records, achieving an AUC-ROC of 0.9731. Addressed severe class imbalance (0.17% fraud) using SMOTE, improving detection of the minority class. Evaluated performance using precision (0.85), recall (0.84), and AUC-ROC, correctly catching 82 of 98 fraud cases in the test set.
Built an image classifier using transfer learning with a pre-trained ResNet50 model, capable of classifying images into 1,000 object categories with top-5 confidence scores. Implemented preprocessing, evaluation, and deployment-ready inference logic with a simple web interface for demo use.
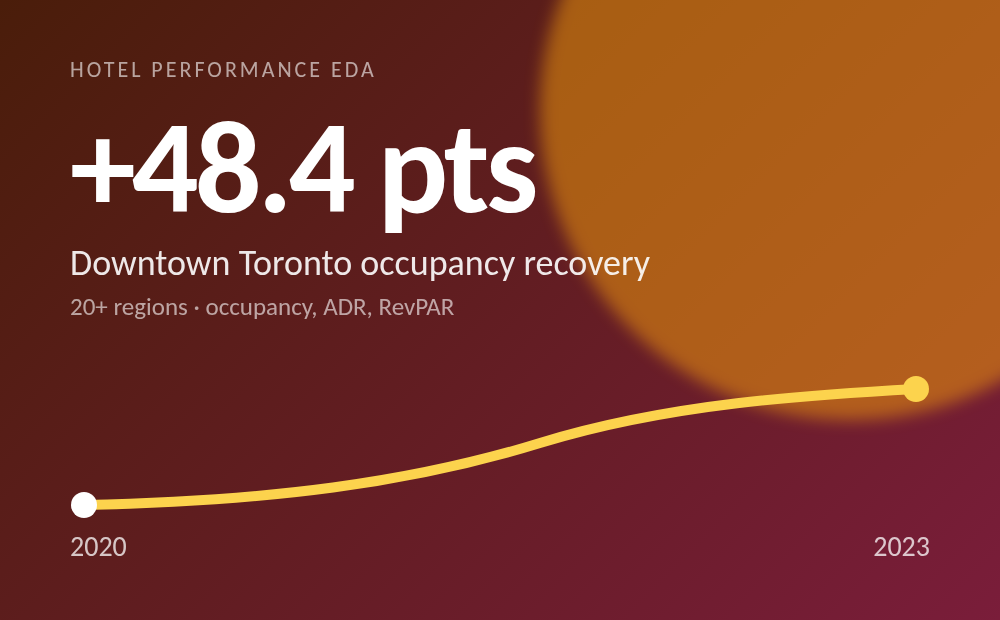
Analyzed occupancy, ADR, and RevPAR trends across 20+ Ontario regions using Ontario open data, finding Downtown Toronto had the largest COVID occupancy recovery (48.4 pp) from 2020–2023. Found a weak positive correlation (0.36) between occupancy rate and ADR, suggesting pricing and demand are largely independent across regional markets.
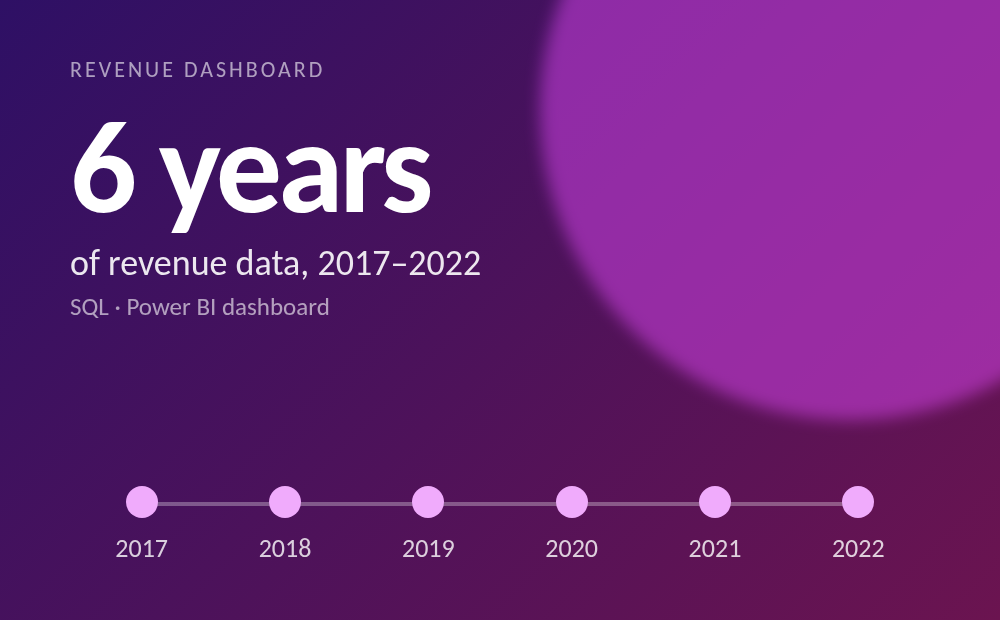
Queried and cleaned 6 years of revenue data (2017–2022) from a public Kaggle department-store dataset using SQL, identifying a peak revenue year in 2018 followed by consistent year-over-year decline. Built an interactive Power BI dashboard visualizing department-level revenue trends for cross-unit performance comparison.